With the diversification and complexity of electrical equipment, the composition of harmonics in power lines has become increasingly rich, and the governance of harmonic pollution has become increasingly challenging. Many instruments have also introduced harmonic measurement functions accordingly. How can we distinguish the measurement methods of these harmonics and accurately use them for harmonic measurement? This article will delve deeper.
In many people‘s understanding, accurate harmonic analysis can only be performed using synchronous sampling. In fact, using asynchronous sampling can also perform harmonic analysis, and in many cases, it is even better than synchronous sampling method. The PA power analyzer provides three harmonic measurement modes: conventional harmonic, harmonic, and IEC harmonic, supporting synchronous and asynchronous harmonic analysis. The complementary use of the two analysis methods can improve the harmonic analysis ability. Below, we will discuss the use of three harmonic modes through a simple calculation method and examples.
Basic Principles of Harmonic Measurement
At present, the most commonly used harmonic analysis method is to use Fourier transform to expand the discrete signal in the time domain into Fourier series to obtain the discrete spectrum, select the corresponding spectral line of each harmonic from the discrete spectrum, and calculate the harmonic parameters.
In actual implementation, due to the "fence effect" of Discrete Fourier transform, when the sampling frequency is not an integral multiple of the fundamental wave, some harmonics may not be at the discrete frequency points after Discrete Fourier transform, and special means need to be used to align the fence gap with the harmonic frequency points we care about. Among them, synchronous sampling method and frequency center of gravity method are the most widely used.
Synchronous sampling method
As the name suggests, it is to synchronize the sampling frequency with the fundamental frequency. This method ensures that the sampling frequency of the data is an integral multiple of the fundamental frequency from the source. For example, the IEC 61000-4-7 standard stipulates that 10 times the fundamental sampling rate is used for 50Hz. The sampled data can be obtained by Discrete Fourier transform to obtain each harmonic component. Synchronous sampling is commonly implemented using hardware PLL, which requires real-time adjustment of the sampling frequency. Frequency locking requires time and is limited by filters and related devices, making it difficult to achieve a wide frequency domain and ensure accuracy when the spectrum is particularly rich.
Frequency center of gravity method
The use of a sufficiently high sampling frequency (generally greater than 4 times the fundamental frequency) can meet the requirements of directly sampling the signal, extending the spectral interval of the signal, and using data points with more cycles to do Discrete Fourier transform to reduce the impact of spectral leakage. Finally, according to the power spectrum distribution characteristics of the Window function, through the spectrum peak and sub spectrum peak of the spectrum, we can find the true spectrum peak frequency point, that is, the center of gravity of the spectrum peak and sub spectrum peak of the discrete spectrum. The fence effect is eliminated through the frequency barycenter method. The barycenter method is used for each harmonic, and a deviation coefficient is also obtained. With this coefficient and the Window function power spectrum, the phase and amplitude information of the corresponding frequency point can be obtained. So far, the asynchronous sampling method has also obtained various harmonics. Limited by the spectral characteristics of the Window function, the method needs to use a high enough sampling rate to ensure that the frequency components of the spectrum interaction is small enough; Moreover, the leakage caused by truncation should not be too large, otherwise the generated false frequencies will be added to the real spectrum, resulting in greater error in the results.
Simple comparison
Based on the above implementation principles, it can be seen that the accuracy of synchronous sampling method depends on the accuracy of PLL, and the later calculation is simple. The filters used in PLL limit the upper limit of the supported fundamental frequencies, so synchronous sampling methods are generally unable to support high fundamental frequencies; Due to the same filter reason, it is not possible to effectively filter out low even harmonics. Therefore, when the amplitude of low even harmonics is large, PLL cannot synchronize fundamental sampling, and the harmonic analysis results are completely incorrect.
The frequency center of gravity method does not require additional filters, and the sampling device can operate at the highest supported sampling frequency, which expands the effective spectral line while increasing the supported harmonic frequency range. To eliminate the impact of leakage, more data needs to be used for Fourier transform. So the frequency center of gravity method introduces several times the computational complexity of synchronous sampling method. In addition, the barycenter method needs to use at least two spectral lines, and is limited by the main lobe width of the Window function. The lower limit of frequency supported by the frequency barycenter method can only reach more than three times the frequency resolution. Due to the fact that the frequency center of gravity method does not have a feedback process and does not rely on signals, the implementation of the analog circuit is simple. In theory, as long as the sampling rate and the data points used are sufficient, the correct results can be obtained.
Specifically, due to the hardware circuit required for synchronous sampling, which is limited by cost and volume, most measuring instruments only support one to two PLL sources, while the frequency center of gravity method does not have this limitation, and can even arbitrarily define the fundamental source (corresponding to the PLL source, used to determine the fundamental wave).
Application examples
The PA power analyzer provides three harmonic modes: conventional harmonic, harmonic, and IEC harmonic. Among them, the conventional harmonic corresponding frequency center of gravity method, harmonic and IEC harmonic corresponding synchronous sampling method. The difference between harmonics and IEC harmonics lies in the fact that IEC harmonics are calculated entirely according to the number of FFT points specified in the IEC 61000-4-7 standard, and the processing flow and calculation parameters specified in the standard are added. The following uses example signals to compare the differences between the two methods:
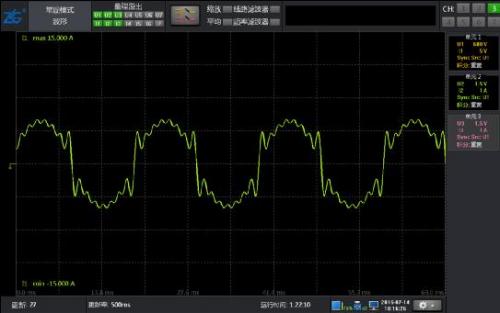
Signal 1: The fundamental frequency is 50Hz, containing 2-15 harmonics, each with a content of 10%
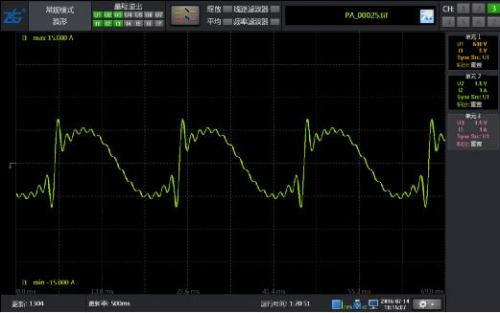
Figure 1: 10% harmonic waveform of 50Hz fundamental wave with 2-15th order content
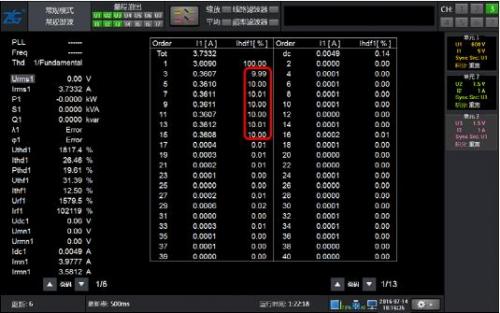
Figure 2: Results of Conventional Harmonic Analysis for 10% Harmonics with 2-15 Times Content of 50Hz Fundamental Waves
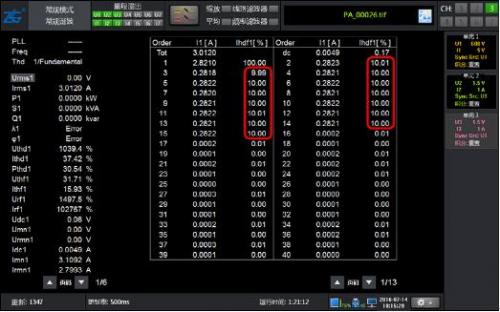
Figure 3: Analysis Results of Harmonic Modes for 10% Harmonics with 2-15 Times Content of 50Hz Fundamental Waves
As shown in Figure 1, a 50Hz signal waveform containing harmonics can obtain the correct harmonic content for both conventional and harmonic modes, with high accuracy.
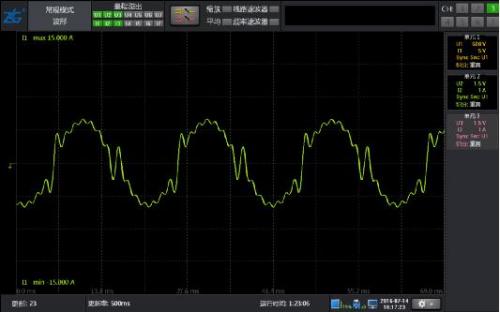
Signal 2: The fundamental frequency is 50Hz, containing odd harmonics ranging from 2 to 15, and the content of each order is also 10%
Figure 4: 10% harmonic waveform of 50Hz fundamental wave with 2-15 odd content
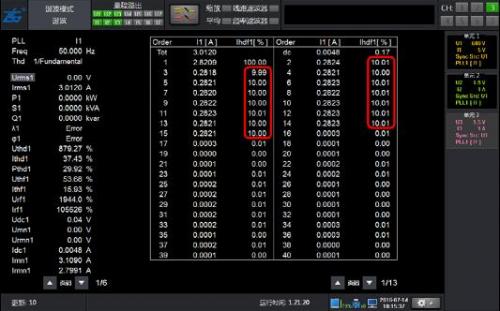
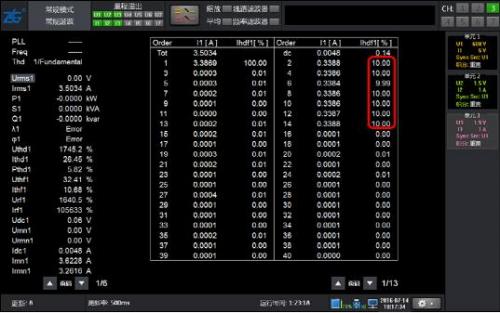
Figure 5: Results of Conventional Harmonic Analysis for 10% Odd Content of 50Hz Fundamental Waves 2-15
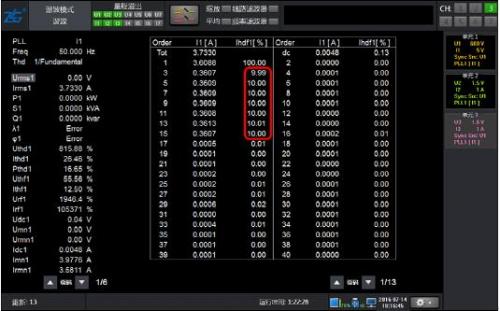
Figure 6 Analysis Results of 10% Harmonic Mode with 2~15 Odd Content of 50Hz Fundamental Waves
As shown in Figure 4, the waveform only contains odd harmonics of 2-15 times, and the results of conventional harmonics and harmonic modes are equally accurate.
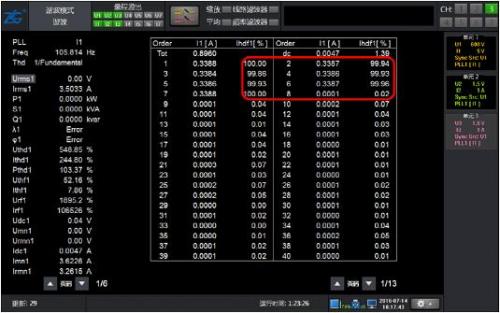
Signal 3: The fundamental frequency is 50, containing 2-15 even harmonics, each with a content of 10%
Figure 7: 10% harmonic waveform of 50Hz fundamental wave with 2-15 even content
Figure 8: Results of Conventional Harmonic Analysis for 10% Even Content of 50Hz Fundamental Waves 2-15
Figure 9 Analysis Results of 10% Harmonic Mode with Even Content of 2~15 Hz Fundamental Waves
As shown in Figure 7, the waveform only contains even harmonics of 2-15 orders of 50Hz fundamental wave. Due to the influence of even harmonics, each fundamental wave period has two more zeros, and the frequency is similar to the fundamental wave. The PLL filter is also unable to filter out this harmonic, so the PLL result is incorrect, resulting in completely incorrect harmonic analysis results. At this time, the conventional harmonic analysis results are still correct and maintain high accuracy. This indicates that conventional harmonics can be unaffected by even harmonics and have the advantage of being less affected by the measured signal when the sampling rate and FFT points are sufficient.
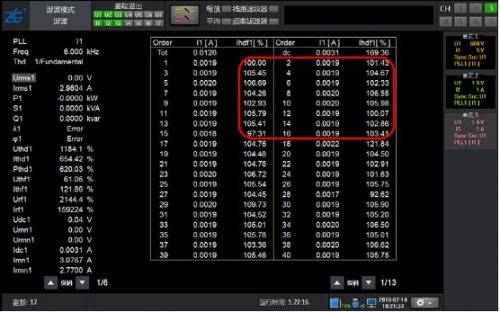
Signal 4: The fundamental frequency is 6kHz, containing 2-15 harmonics, each with a content of 10%

Figure 10: 10. 10% harmonic waveform of 6kHz fundamental wave with 2-15th harmonic content
Figure 11: Conventional harmonic analysis results for 2-15 times content of 6kHz fundamental wave at 10%
Figure 12 Analysis Results of 10% Harmonic Mode with 2-15 Times Content of 6kHz Fundamental Wave
As shown in Figure 10, the waveform containing 2-15th harmonics of the 6kHz fundamental wave cannot be measured due to exceeding the frequency range supported by the harmonic mode. However, conventional harmonic analysis uses a sampling rate of 200kHz, and the 15th harmonic frequency of 6kHz is 90kHz, which is less than half of the sampling frequency. Therefore, it can still be accurately measured.
summary
From the above example, it can be seen that asynchronous sampling broadens the range of harmonic analysis and can achieve complementarity in many situations where synchronous sampling is constrained, making it a powerful harmonic analysis method.
It should be pointed out that although the results of conventional harmonic analysis in the above cases are correct and have high accuracy, when the harmonic mode PLL is correct, the stability and accuracy of the harmonic mode in higher harmonics will be higher than that of conventional harmonics, because conventional harmonics have accumulated errors in the frequency of higher harmonics, and both ends of the spectrum will be affected by Negative frequency. One fatal drawback of conventional harmonics is that the lower limit of frequency is high (the lower limit of fundamental frequency supported by conventional harmonics in the PA5000 power analyzer is 15Hz), and it is necessary to ensure sufficient adoption points during the update cycle.
|
Disclaimer: This article is transferred from other platforms and does not represent the views and positions of this site. If there is any infringement or objection, please contact us to delete it. thank you!
中恒科技ChipHomeTek
|


 Service mailbox
 13823783658
 ChatNow