1、 Preface
Using portable electronic products, we hope to know the remaining power of the battery and the continuous working time at any time, and adjust relevant applications accordingly. This will undoubtedly be a very convenient thing, especially suitable for business people using smart phones. Battery power detection technology has been common in notebook computers. Most notebook computers have power management options, providing different power supply working modes and battery alarm functions. However, in the more miniaturized portable product market, this technology is still rare.
The functions provided by portable products are more and more complicated. Users increasingly need to accurately monitor the battery power, so as to flexibly manage the available power supply, clearly display the remaining working time, and extend the system operation time as much as possible. At present, the electricity measurement methods adopted by most mobile phones are relatively simple and lack of accuracy. At present, the mainstream detection method is to simply measure the battery voltage and estimate the corresponding remaining battery capacity. The total power is divided by 4 or 5, that is, the power bar of 4 or 5 grids that can usually be seen on the mobile phone screen. Therefore, the accuracy of each grid is 25% or 20%, which obviously cannot meet the application with high accuracy requirements.
This voltage estimation method is usually as follows: when a battery is discharged, the voltage of the battery will gradually decrease with the loss of battery power. In this way, a relatively simple and effective corresponding relationship can be obtained, that is, voltage corresponding capacity. According to the discharge curve of the normal use of the battery (such as 100mA discharge), the time is divided into four equal parts. Taking the lithium battery with a charge limit voltage of 4.2V as an example, such a corresponding relationship can be listed as 4.20v-100%, 3.85v-75%, 3.75v-50%, 3.60v-25%, and 3.40v-5% (because the mobile phone cannot completely use up the power of the battery, it may be shut down automatically when it is lower than 3.40v). Obviously, the highest accuracy is only 25%. In addition, the battery voltage will change abruptly with the power emission of RFPA, and will generally decrease by 0.2v-0.3v. If we blindly use the voltage simulation method, the error will be greater. In order to solve the measurement problem that the battery voltage suddenly decreases, the current common method of engineers is to use the software algorithm to filter the average value to average the battery voltage within a period of time. If the average battery voltage in this period of time does decrease, the estimated amount of electricity is indeed reduced. Otherwise, it is considered that the amount of electricity has not changed.
The method of battery voltage simulating residual power does have some defects, but the method of calculating residual power by real-time monitoring battery consumption with coulometer is very accurate. Fairchild‘s fan4010 is a typical device for this application. It is a current detection sensor, which is specially used to detect the charging / consumption current of the portable device battery. It can convert the current signal through the precision detection resistor into the voltage signal that can be detected by the ADC, so as to calculate the real power consumed in a period of time.
2、 Typical design of hardware circuit
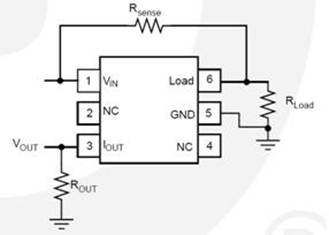
In order to meet the needs of high-precision battery power monitoring, the fan4010 can meet the requirements well by adding a suitable application circuit and a specific software control algorithm. Fig. 1 is a typical application block diagram of the fan 4010. Only two resistors RSENSE and rout are needed in the periphery to form a high-precision amplification circuit. Figure 2 is the schematic diagram of the internal structure principle, so there is VSENSE = I_ Load * RSENSE, Vout = 0.01 * VSENSE * rout, so the two relations can wait until I_ Load = 100 * Vout / (rout * RSENSE), so as long as the ADC is used to monitor the voltage on Vout, and then divided by the known resistance values rout and RSENSE, the accurate load consumption current can be obtained, and the current is integrated with time, that is, the accurate value of the consumed power can be achieved. The accurate remaining power can be obtained by subtracting the accurate power consumption value from the total power. The same applies to the charging circuit.
Fig. 1 application block diagram of fan4010
Fig. 2 Schematic diagram of internal structure principle of fan4010
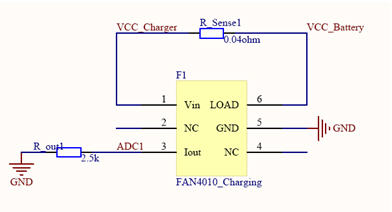
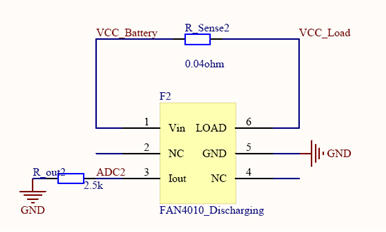
The typical application diagram of fan4010 and the selection requirements of RSENSE and rout are as follows. Fig. 3 is a charging circuit of the battery and Fig. 4 is a discharging circuit of the battery.
Fig. 3 reference schematic diagram of charging part
Fig. 4 reference schematic diagram of discharge part
Rsense(R_sense1/R_sense2)
These two resistors are connected in series on the charge and discharge paths. Therefore, we need a low resistance current sampling resistor. Paradoxically, if RSENSE is too low, precision will be lost. If RSENSE is too large, the voltage drop and power consumption on this resistor will be large. Therefore, the selection of RSENSE should be an ideal comprehensive balance of high accuracy and allowable voltage loss. Although the fan 4010 has the lowest power consumption on the sampling resistor when the VSENSE value is low, a larger RSENSE value can provide more accuracy. However, a large RSENSE will produce a relatively large voltage drop, reducing the effective voltage that can be provided to the load, which will be very troublesome in low-voltage applications, especially battery powered applications. Because of this, it is necessary to know the expected maximum allowable load current and load supply voltage well in the design. In order to maximize the accuracy, it is recommended that the selection of RSENSE should meet the following conditions:
10mV<200MV P>
Rout(R_out1/R_out2)
The resistance rout connected to the GND is used to generate a voltage signal that can be detected by the ADC. Its selection mainly depends on two parameters: I_ I_load * RSENSE / 100) and the voltage sampling range of the ADC. Maximum I_ The maximum Vout generated by load cannot exceed the maximum sampling voltage of ADC. In order to ensure the maximum accuracy, it is also hoped that the maximum Vout can be as close as possible to the maximum sampling range of the ADC.
In addition, in order to ensure the maximum linearization of fan4010, the selection of rout shall meet the relationship:
Where Vin is the input voltage, IOUT_ The value of FS is the corresponding value in Table 1. When the maximum VSENSE is different, the value is different. For example, if the maximum VSENSE is 500mv, IOUT_ fs=5mA。
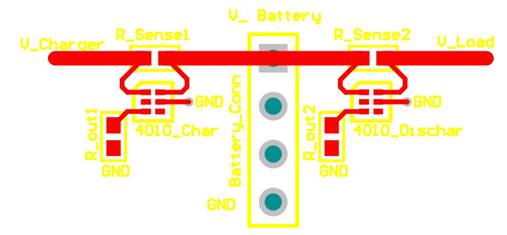
The layout design legend is shown in Fig. 5. The basic principle of wiring is that the fan4010 is as close to the charging / discharging path as possible.
Figure 5 layout example
3、 Typical software design
The algorithm of electric quantity calculation is shown in Fig. 6, and relevant descriptions are as follows:
Premise: there are two batteries, a (total capacity of about 1000mah, uncertain) and B (total capacity of about 1500mah, uncertain), which may be used on the mobile phone P.
Insert battery (power on) → → whether to calibrate battery (default no) → → no → → call battery capacity curve a (default) (if battery B is used, it is modified to use battery capacity curve b) → → jointly evaluate the percentage of remaining power through battery VCC and monitoring power consumption at the battery end.
→ → yes → → to calibrate, please ensure that the battery is fully charged → → select the calibration curve, a or B? → → record the highest end battery vcc-h, and the battery power percentage is 100% by default at this time → → monitor the power consumption and battery terminal voltage respectively according to each calculable time period → → automatically shut down the battery after it is used until the battery runs out of power, record the state voltage vcc-l and the battery percentage is 0% by default at this time, and calculate the total power loss Q, which is the total Q of the future capacity curve.
|
Disclaimer: This article is transferred from other platforms and does not represent the views and positions of this site. If there is infringement or objection, please contact us to del
中恒科技ChipHomeTek
|


 Service mailbox
 13823783658
 ChatNow